22 largest natural gas fields
in the World
| Field, Country | Size estimate |
|---|
| 1. North Dome - South Pars, Qatar-Iran | up to 1,200 trillion cubic feet (950 in Qatar) |
| 2. Urengoy, West Siberia, Russia | >275 trillion cubic feet |
| 3. Yamburg, West Siberia, Russia | prob. >200 trillion cubic feet |
| 4. Orenburg, Volga Region, Russia | prob. >200 trillion cubic feet |
| 5. Shtockmanov, Barents Sea, Russia | prob. >200 trillion cubic feet |
| 6. Umm Shaif + Abu el-Bukush, Abu Dhabi | 175 trillion cubic feet |
| 7. Zapolyarnoye, West Siberia, Russia | 150+ trillion cubic feet |
| 8. Kharasevey, West Siberia, Russia | 150+ trillion cubic feet |
| 9. Bovanenko, West Siberia, Russia | 125 trillion cubic feet |
| 10. Medvezh'ye, West Siberia, Russia | 100+ trillion cubic feet |
| 11. Hassi R'Mel, Algeria | 100 trillion cubic feet |
| 12. South Pars, Iran | 100 trillion cubic feet |
| 13. Panhandle-Hugoton, USA (TX-OK-KS) | 80 trillion cubic feet |
| 14. Groningen, Netherlands | 66 trillion cubic feet |
| 15. Ghawar Oil Field, Saudi Arabia | 60 trillion cubic feet |
| 16. North Pars, Iran | 48 trillion cubic feet |
| 17. Dauletabad-Donmez, Turkmenistan | 47 trillion cubic feet |
| 18. Karachaganak, Kazakstan | 46 trillion cubic feet |
| 19. Shatlyk, Turkmenistan | 35 trillion cubic feet |
| 20. Yashlar, Turkmenistan | 27 trillion cubic feet |
| 21. Blanco (San Juan), USA (NM) | 23 trillion cubic feet |
| 22. Gazli, Uzbekistan | 20 trillion cubic feet |
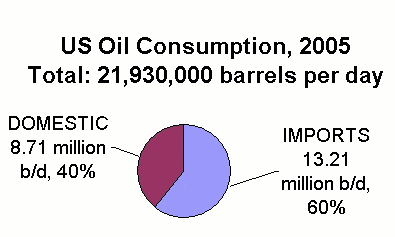
 IN 1994, U.S. OIL IMPORTS EXCEEDED 50% OF CONSUMPTION FOR THE FIRST TIME. In 1999, US imports were about 11 million barrels per day, compared to our domestic production of 6 million barrels per day. You do the math.
Dick Gibson is available to speak on the topics on this page.
Visit our Speaker's Bureau for details. |
SOURCES OF US OIL IMPORTS
The Map below is based on data from Energy Information Administration for 2003,
and includes both imported crude and petroleum products (see note and table below
the map for 2001-2002). Canada, Saudi Arabia, Mexico, and Venezuela are the leading
suppliers. The map shows all countries that supply 1% or more of our imports,
and the countries shown total about 85% of all imports.
2004
UPDATE: US Imports total about 61% of consumption: 13.12 million barrels per day
in July 2004, out of total consumption of 21.4 million barrels per day. At the end of 2005, US production was at the lowest point since the late 1940s (4.86 million b/d) and imports accounted for 67% of total consumption.
| NOTE ON IMPORTS FROM IRAQ: US oil imports from Iraq have fluctuated greatly over the past 15 years. In 1990, imports from Iraq accounted for about 6.4% of our imports. From 1991 to 1996, due to sanctions, Iraq provided NO exports to the US. In 1999 (average 6.7%), 2000 (5.4%), 2001 (6.7%), and 2002 (3.9% - yes, less than four percent), amounts varied a lot from month to month. More data at Energy Info. Administration |

|
In 2002, Canada led the world in our sources of imports, at 17%, with Saudi
Arabia (13.7%), Mexico (13.5%), and Venezuela (12%) in a virtual three-way tie
for second. The year before the percentages were Canada - 15.4%, Saudi Arabia
- 14%, Venezuela - 13%, and Mexico - 12.1%. Canada has been the leader since at least 2001. In 2002,
US imports from the Persian Gulf region amounted to 19.8 percent of our total
imports. The same year, a total of 40% came from OPEC member nations -- which
include countries such as Venezuela and Indonesia that are outside the Persian
Gulf. More Information
While the countries on the map above supply the greatest proportion of US crude and products imports, in January to March 2006, the US also imported crude oil and/or refined products from Argentina, Australia, Azerbaijan, Bahrain, Belarus, Belgium, Bolivia, Brazil, Brunei, Cameroon, Chad, Chile, China (both mainland and Taiwan), Congo (Brazzaville), Costa Rica, Denmark, Egypt, El Salvador, Estonia, Finland, France, Gabon, Germany, Guatemala, Hungary, India, Indonesia, Italy, Ivory Coast, Jamaica, Japan, Kazakhstan, Latvia, Libya, Lithuania, Malaysia, Midway Islands, Netherlands, Netherlands Antilles, Oman, Peru, Poland, Portugal, Qatar, Romania, Russia, Senegal, Singapore, South Africa, Spain, Sweden, Syria, Thailand, Tonga, Trinidad and Tobago, Turkey, Turkmenistan, Ukraine, United Arab Emirates, Uruguay, Viet Nam, and Yemen. Source
World Consumers and Importers 2003: see EIA here
for more info.
Leading Oil Consumers | Leading Oil Importers | Leading sources of US imports |
USA (20 million barrels per day)
China (5.6)
Japan (5.5)
Germany | USA (11.1 million b/d)
Japan (5.3)
Germany (2.5)
South Korea (2.2) | Canada (17%)
Saudi Arabia (14.5%)
Mexico (13%)
Venezuela (11%) |
Why are gasoline prices so high?
THEY AREN'T.
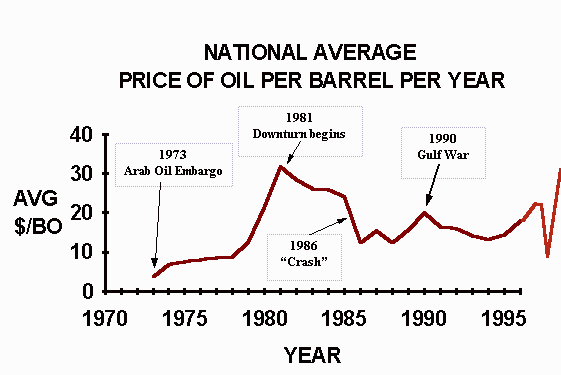
Compared to 1981, inflation adjusted-prices today are 27 cents CHEAPER than the $3.11 all-time high (inflation-adjusted) gasoline cost in March 1981. SOURCE. For one example of a 1979-2005 inflation-adjusted and nominal price chart for gasoline, click here. And here is another version.
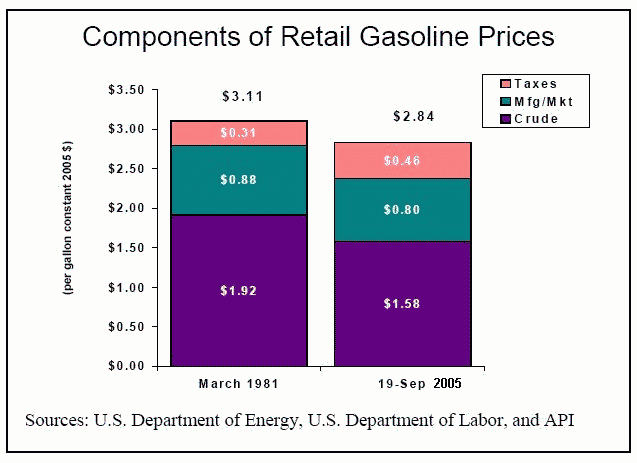
Some Factors in the cost of gasoline in the US
For an alternative view of costs that go into oil and gasoline, including things that are difficult to quantify, such as the cost to the environment and costs of military and political defense of oil reserves, visit Greenpeace. This article will show some of the hidden oil you use in having breakfast. For the realistic perspective of a "Peak Oil" believer, Click Here. • © 2007 Gibson Consulting.
A useful essay about how oil prices come about
This page - like all those in this site and like most on the web - is copyrighted and
wholesale copying and re-posting as your own information will not be tolerated.
You are encouraged to use the information, and credit is appreciated. |
The price of Crude is up - approaching $100 per barrel.
This is because worldwide supply is tight and 1) gasoline demand in the US is up despite high prices - 4.3% more than 2003. Americans simply refuse to conserve. This is not trivial considering that the US, with 5% of the world's population, consumes 45% of the gasoline produced on earth. 2) Gasoline demand is surging in China, where crude oil imports increased 30% in 2003. |
| Refinery capacity in the US (and in the world) is near its maximum. Hurricanes Katrina and Rita impacted some refineries. Even before Katrina, average US refinery capacity was much less than US gasoline consumption More info. Oil tanker capacity for trans-oceanic shipping is also 100% reserved for the forseeable future, and shipping costs have nearly tripled [more info]. |
| The US deficit, around $500 billion in 2004, causes the value of the dollar to decline. Because oil is priced in dollars, no matter where in the world it comes from, producers want higher prices in order to maintain their income. |
| The US Government is buying at these high prices supplies for the strategic petroleum reserve. A minor impact, but some. |
| Local requirements for special gasoline blends to meet environmental regulations result in smaller batches, which are more expensive for refineries to produce. Applies especially to California. |
| Costs reflect distance from refineries (transportation cost). In the US, 50% of gasoline is refined in the Gulf Coast. |
| Variations reflect local taxes. Federal excise tax on gasoline is about 19˘ per gallon; state tax averages about 23˘ per gallon; in California there is an additional 7.5% sales tax. |
| Economic woes in Venezuela are impacting US imports more than problems in the Middle East. US imports from Venezuela were down 19% in 2003, and Venezuela, Mexico, Canada, and Saudi Arabia are the US's main suppliers, normally at about 15% each — but Venezuela in 2003 only provided about 12% of our imports (see table above). |
| Any time there is a problem with a pipeline or refinery, it can impact the supply of gasoline at least in local markets, and the price can spike. |
| Credit card fees paid by retailers amount to about 3.5%, or 7 cents a gallon at $2.00 per gallon. This is more than enough to eliminate all profit for the retailer, and in many cases results in an actual loss of several cents per gallon -- absorbed either through increased pump prices or in other elements of a retailer's business. Retailers with no other sources of profit may go out of business, further restricting ability to deliver gasoline. So don't blame the corner gas station -- even the company-owned ones. The latter may absorb such losses through profits elsewhere in the system, but a loss is still a loss. |
| Even with all of this, the true price of gasoline has fallen more than 40% from its inflation-adjusted price of $3.11 per gallon in 1980-81. And in the US, at $2.50 per gallon (2005), we pay about one-half to one-third of the price western Europeans and others have paid for many years. Icelanders pay about $6.12 per gallon (2004). Much of that cost is in national taxes that support health care and other programs. |
| Although the price of oil is ultimately governed by supply and demand -- with the greatest demand in the US (25% of world oil consumption; 45% of world gasoline consumption) and two-thirds of US demand in the transportation sector -- nervousness on the part of oil traders also impacts the short-term price. For example, in early 2006 real (e.g., Nigeria's shut-in 500,000 barrels per day of production) and perceived possible (e.g., jitters over Iran and political issues in Venezuela and elsewhere) supply problems DO result in increased prices, as buyers are willing to pay higher prices for something that they think may soon be in shorter supply. |
| See also the EIA page, Primer on Gasoline Prices. |
Costs to produce and sell a gallon of gasoline in the US
Oil company profits: A perspective
Earnings, Revenues, Profits (Billions) for selected companies, recent quarter, 2005
Source: Bloomberg News, reported in AAPG Explorer Dec. 2005 |
Company | Net Profit | Revenue | Profit Margin |
Citigroup (banking) | $7.1 | $21.5 | 33% |
Microsoft | $3.1 | $9.7 | 32% |
Coca-Cola | $1.3 | $6.0 | 21% |
Procter & Gamble | $2.0 | $14.8 | 14% |
General Electric | $4.7 | $41.6 | 11% |
ExxonMobil | $9.9 | $92.6 | 11% |
ConocoPhillips | $3.8 | $48.7 | 8% |
IBM | $1.5 | $21.5 | 7% |
Chevron | $3.6 | $51.1 | 7% |
Wal-Mart | $2.8 | $76.8 | 4% |
Oil industry average profit margin is about 8.2%; (3rd Q. '05)
for all US industry, the average is about 6.8%.
Profits in the oil industry were easily outpaced by those of the
Pharmaceuticals, Banks, Household Products, Software, Telecommunications,
Semiconductors, Consumer Services, and Food, Beverage and Tobacco sectors. |
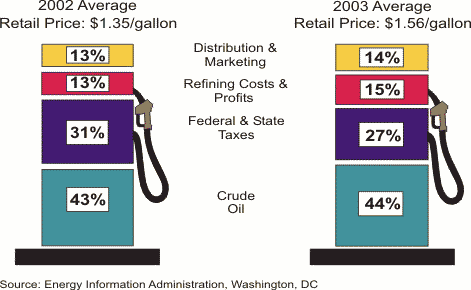
One barrel of crude oil makes about 19˝ gallons of gasoline,
9 gallons of fuel oil, 4 gallons of jet fuel, and 11 gallons of other products,
including lubricants, kerosene, asphalt, and petrochemical feedstocks to make
plastics. More, plus a graphic. The ultimate
cost of a gallon of gas at the service station depends mostly on the price of
crude oil, and most of the profit after expenses goes to the owner-producers of
the oil, whether they are governments or oil producing companies. The following
table shows an approximate breakdown of the costs that go into a gallon of gas
in the US. Almost everywhere in the world outside the US, people pay MUCH more
for gasoline, largely because of much larger government taxes, which amount to
around $3 to $4 per gallon in many European countries (and which support government-subsidized health care and other programs). Graphic comparison. Naturally, all the values
in the table below vary from place to place; these are general estimates. "Producer" generally means the country that owns the oil - companies like Exxon and Shell and Conoco must purchase much of the oil they refine and market, more or less at the going price of crude on the world market. Long-term contracts may reduce their cost by a bit, but when the price of oil is $60, Exxon is probably buying such oil from Saudi Arabia for something like $58 or more."Production
cost" includes a world-wide average of US $7.35 per barrel in finding costs, $3.57
per barrel in lifting cost (what it takes to operate a producing well), and $1.00
in production taxes per barrel. 2003 numbers from EIA.
It is difficult to find separate figures for refining cost and profit, and the
other cost/profit breakdowns, so the numbers are guesses but the totals for each
category reflect percentages determined by the EIA (percentages for previous years
shown in the graphic from EIA - I based the numbers in the table on $2.70 a gallon
and percentages based on the most recent information I could find - 18% refining,
16% distribution, marketing, and retailing). If anyone has a good breakdown
of transportation, marketing, and retailing costs and profits, or other data sources,
please let me know. See also the EIA
Primer on Gasoline Prices and this
article and this GAO report
and This
One and another. And Gas Q&A. • See also Who sets the price of oil?
This page offers an April 2006 breakdown of the components of the price of a gallon of gasoline: 54% is the price of crude; 21% is the cost of refining; 2% is the cost of transportation; 17% is taxes; they don't list a cost for retailing and marketing; and profit to refiner, transporter, and retailer is 6%. This page shows a breakdown of the price of a gallon of gasoline in California - and makes very clear that transporters, marketers, and retailers are making very little. When transportation costs (AND profit) + marketing cost (AND profit) + retailer cost (AND profit) adds up to three cents a gallon, you know they are not making much.
| Expense | Amount per gallon |
|---|
| Production costs | 33˘ |
| Producer profit | 95˘ |
| Refining costs | 40˘ |
| Refining profit | 10˘ |
| Transportation costs | 12˘ |
| Transportation profit | 9˘ |
| Marketing costs | 4˘ |
| Marketing profit | 4˘ |
| Retailer costs | 8˘ |
| Retailer profit | 8˘ |
| US Taxes | 19˘ |
| State taxes (avg. 23¢) | 6˘ to 39˘ details |
| Local taxes | 0 to 20˘ |
| TOTAL | $2.65 |
For a comparison of the profit margins in the oil industry to other US businesses, click here for a PDF file from the American Petroleum Institute.
World oil export leaders and their reliance on the U.S. consumer market
(numbers are in million barrels per day, 2004 data from EIA)
chart ©2006 Gibson Consulting |
| Country | Net Oil Exports | U.S. Imports | Reliance on U.S. Market |
| Saudi Arabia | 8.7 | 1.27 | 15% |
| Russia | 6.6 | 0.047 | <1% |
| Norway | 2.9 | 0.1 | 3% |
| Iran | 2.5 | 0 | 0% |
| Venezuela | 2.3 | 1.01 | 44% |
| UAE | 2.3 | 0.021 | <1% |
| Kuwait | 2.2 | 0.27 | 12% |
| Nigeria | 2.1 | 1.16 | 55% |
| Mexico | 1.8 | 1.66 | 92% |
| Canada | 1.8 | 1.8 | 99+% |
| Algeria | 1.6 | 0.26 | 16% |
| Iraq | 1.4 | 0.57 | 41% |
| Libya | 1.3 | 0.051 | 4% |
| Kazakhstan | 1.0 | 0 | 0% |
| Qatar | 1.0 | 0 | 0% |
Compiled by Dick Gibson, Gibson Consulting, 301 N. Crystal St., Butte, MT 59701
Want to know more?
Gibson Consulting recommends: Read The Prize, by Daniel Yergin. |

Back to Popular Geology

©1997-2007 Gibson Consulting
Background image of drilling well in Utah in 1981 © 2000 by Dick Gibson


 US OIL DEMAND, 2004: Over 20 million barrels
per day, up from January 2002, when demand was about 18.5 million barrels
per day, = 777 million gallons. If lined up in 1-gallon cans, they
would encircle the earth at the equator almost 6 times (about 147,000 miles of
cans) — every day. Here's another image: EVERY DAY, the US consumes
enough oil to cover a football field with a column of oil 2500 feet tall. That's
121 million cubic feet. 55-60% of US consumption is imported at a cost of
$50 billion+ per year, amounting to the largest single element of our trade
deficit. In summer 2004, thanks to higher prices, increased demand, and lower
production, record trade deficits of more than $50 billion per month were recorded,
with approximately 30% of that attributable to imported energy costs. In
September 2004, the US reported its lowest monthly oil production in 55 years,
at an average of 4.85 million barrels per day.
US OIL DEMAND, 2004: Over 20 million barrels
per day, up from January 2002, when demand was about 18.5 million barrels
per day, = 777 million gallons. If lined up in 1-gallon cans, they
would encircle the earth at the equator almost 6 times (about 147,000 miles of
cans) — every day. Here's another image: EVERY DAY, the US consumes
enough oil to cover a football field with a column of oil 2500 feet tall. That's
121 million cubic feet. 55-60% of US consumption is imported at a cost of
$50 billion+ per year, amounting to the largest single element of our trade
deficit. In summer 2004, thanks to higher prices, increased demand, and lower
production, record trade deficits of more than $50 billion per month were recorded,
with approximately 30% of that attributable to imported energy costs. In
September 2004, the US reported its lowest monthly oil production in 55 years,
at an average of 4.85 million barrels per day.
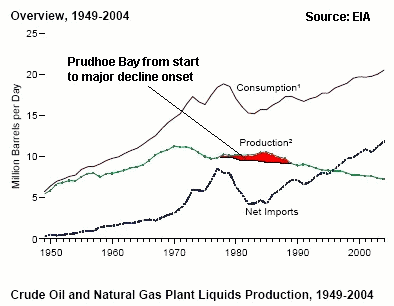 US PRODUCTION, early 2002: About 5.9 million barrels of oil per day, plus about 2 million barrels of natural gas liquids and condensate; and 55 billion cubic feet of gas per day. Oil production is a decline from 8-9 million b/d in 1986.Update, 2005: at the end of 2005, US crude oil production stood at 4.86 million b/d, the lowest value in more than 50 years. Imports (10.01 million b/d) amounted to 67% of consumption. As shown in the figure at left, even when US production was at its peak in 1970 (and accounted for more than 40% of all the oil produced in the world), it could not keep up with consumption. Today's 21 million barrels per day consumption FAR outpaces our domestic production of 4.86 million barrels per day.